
Figure 4.
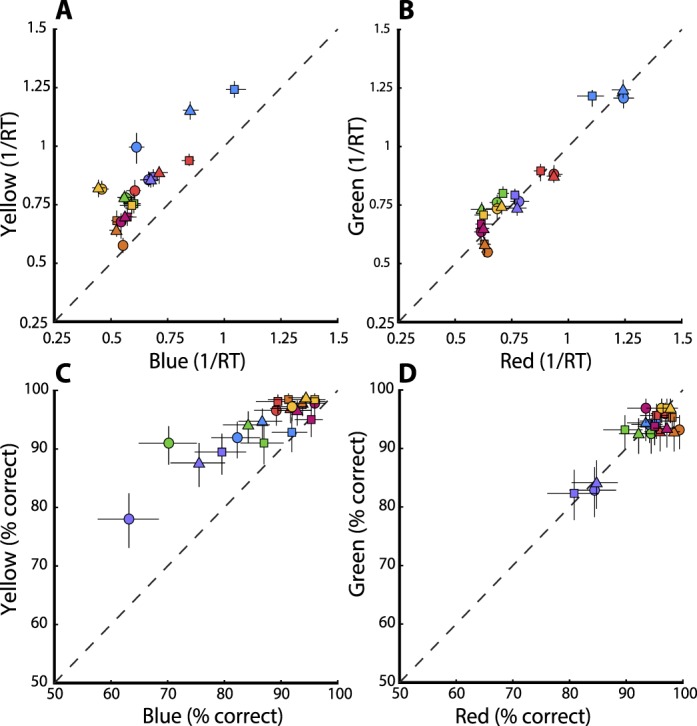
Salience comparisons of yellow versus blue and green versus red. (A, B) A salience index was calculated as the median of (1/RT) for all (A) blue-yellow and (B) red-green conditions across seven observers. (A) Yellow targets were detected significantly faster than their complementary blue targets; ○ = cardinal blue versus yellow; □ = unique yellow versus complementary blue; △ = unique blue versus complementary yellow. (B) Significant differences within red–green pairs were not reliably found; ○ = cardinal red versus green; □ = unique green versus complementary red; △ = unique red versus complementary green. Each color represents a single observer. Error bars denote 95% confidence intervals for the median. (C, D) Performance accuracy was calculated for all blue–yellow (C) and red–green (D) pairs. (C) Yellow targets were more accurately detected than their complementary blue targets. Symbols are the same as in (A). (D) Significant differences within red–green pairs were not reliably found. Symbols are the same as in (B). Each color represents a single observer. Error bars denote Clopper-Pearson 95% confidence intervals.