
Figure 2. LA volume and function during the cardiac cycle.
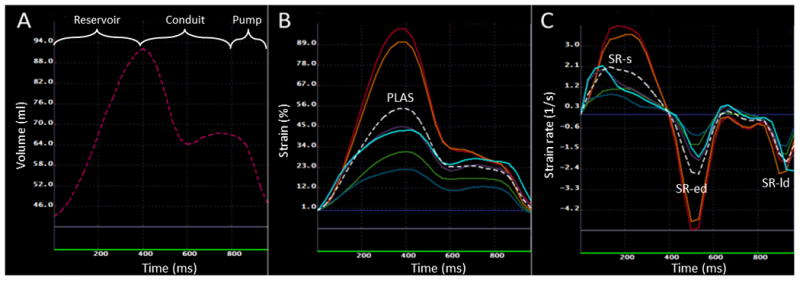
A: Changes in LA volume during reservoir, conduit and booster pump phases. The volume curve is a composite of measured volumes using 2 and 4 chamber views. B: LA longitudinal strain in different segments of LA, the dotted white line shows the average of LA longitudinal strain in all segments. PLAS: peak global longitudinal LA strain; C: LA longitudinal strain rate in different LA segments. The white dotted line shows the average of the strain rate in all segments. The points for systolic strain rate (SR-s), early diastolic strain rate (SR-ed) and late diastolic strain rate (SR-ld) have been shown.