
Figure 4.
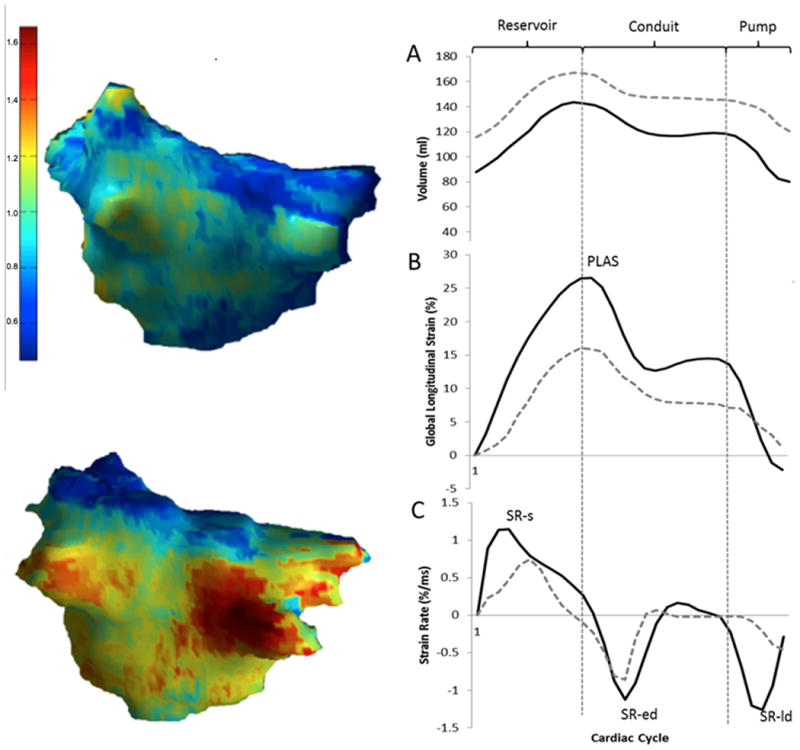
Left: Examples of image intensity ratio map of two LA with mild (top) and extensive (bottom) enhancement. Right: Comparing LA function in two patients with mild (solid black line) and extensive (dotted gray line) LA enhancement A: changes in LA volume during systole (reservoir), early diastole (conduit), and late diastole (pump). B: changes in global longitudinal LA strain during cardiac cycle. More extensive LA enhancement was associated with smaller peak global longitudinal atrial strain (PLAS). C: LA longitudinal strain rate during cardiac cycle. In this example the patient with more extensive LA enhancement has smaller systolic strain rate (SR-s), early diastolic strain rate (SR-ed), and late diastolic strain rate (SR-ld)