Figure 6.

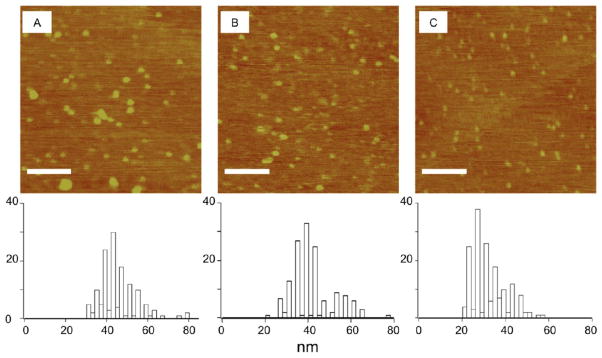
AFM images of β-CD:F127 PRTx at 10−5 mg/mL (A), 10−7 mg/mL (B) and 10−9 mg/mL (C) with probe sonication. Scale bar represents 500 nm. Size distributions are shown below images.

AFM images of β-CD:F127 PRTx at 10−5 mg/mL (A), 10−7 mg/mL (B) and 10−9 mg/mL (C) with probe sonication. Scale bar represents 500 nm. Size distributions are shown below images.