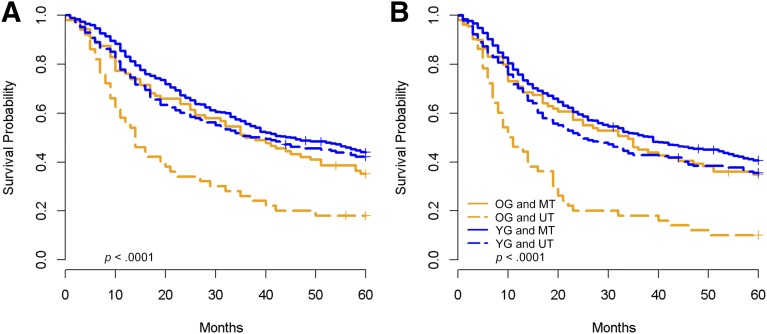
Figure 2.
Kaplan-Meier survival plots for all patients with late-stage disease (stages III and IV) by age group (younger vs. older) and therapy (unimodality versus multimodality). (A): Overall survival. (B): Progression-free survival.
Abbreviations: MT, multimodality therapy; OG, older group; UT, unimodality therapy; YG, younger group.

