
Figure 8.
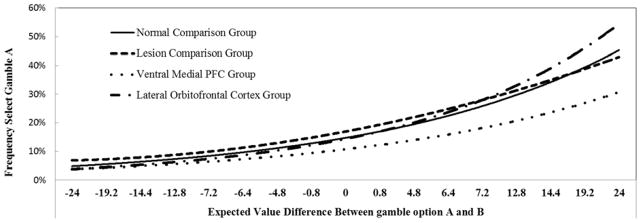
This figure illustrates the percentage of time Gamble A was chosen as a function of the value of Gamble A minus the value of Gamble B. The logistic curves of normal and lesion comparison subjects, and LOFC subjects are similar; VMPFC subjects however have a shallower logistic curve reflecting a choice pattern indicative of decreased sensitivity to differences in expected value between option A and option B.