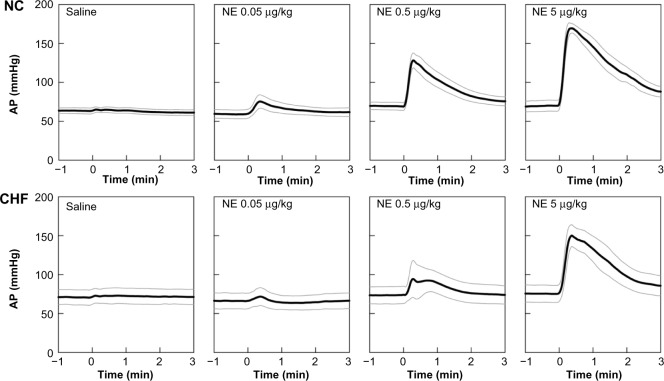
Figure 3.
Time series of 10-second moving averaged signals of arterial pressure (AP) in response to intravenous injections of saline and 0.05-, 0.5-, and 5-μg/kg norepinephrine (NE) injections averaged for the normal control group (NC, n = 8, top panel) and for the chronic heart failure group (CHF, n = 5, bottom panel).
Note: Black and gray lines indicate mean values and mean ± standard error values.

