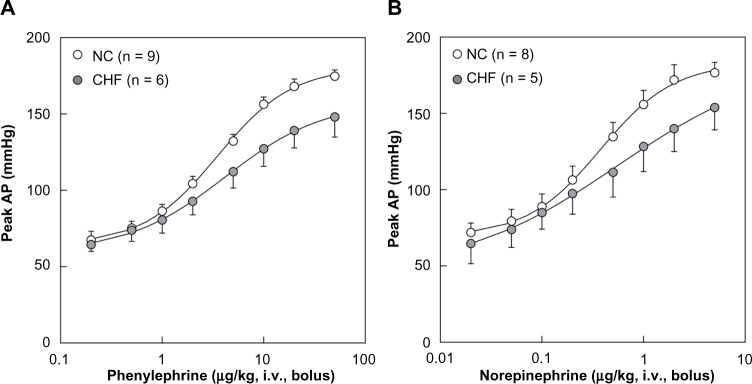
Figure 4.

(A) Relation between the dose of phenylephrine and the peak arterial pressure (AP) response. (B) Relation between the dose of norepinephrine and the peak AP response. Data points represent means and standard errors. Smooth curves represent four-parameter logistic functions derived from the mean data points in each group.
Abbreviations: NC, normal control; CHF, chronic heart failure; iv, intravenous administration.
