
Figure 5.
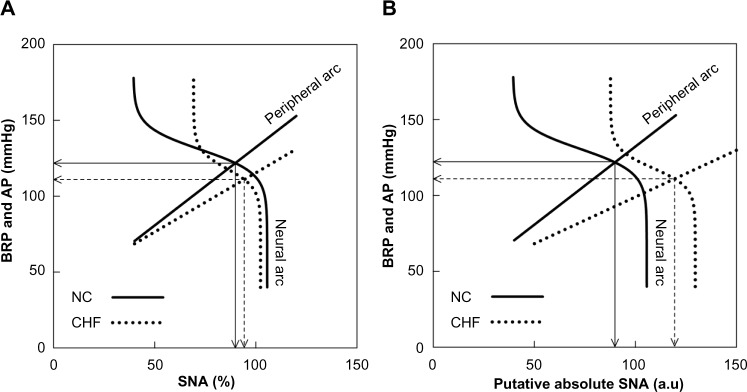
(A) Baroreflex equilibrium diagrams of normal control (NC) and chronic heart failure (CHF) constructed using mean parameter values of the neural and peripheral arcs in our previous study.16 In the neural arc of NC, the response range of SNA is 66.2%, the slope coefficient is 0.13 mmHg−1, the midpoint input pressure is 130.8 mmHg, and the lower plateau of SNA is 39.4%. In the peripheral arc of NC, the slope is 1.03 mmHg/% and the intercept is 29.3 mmHg. In the neural arc of CHF, the response range is 33.1%, the slope coefficient is 0.16 mmHg−1, the midpoint input pressure is 118.1 mmHg, and the lower plateau of SNA is 69.2%. In the peripheral arc of CHF, the slope is 0.78 mmHg/% and the intercept is 37.5 mmHg. (B) Baroreflex equilibrium diagrams of NC and CHF when the SNA axis for the CHF group was scaled so that the slope of the peripheral arc in CHF relative to that in NC became 0.6.
Notes: Solid arrows indicate the operating point in NC. Dashed arrows indicate the operating point in CHF.
Abbreviations: AP, arterial pressure; au, arbitrary units; BRP, baroreceptor pressure; SNA, sympathetic nerve activity.