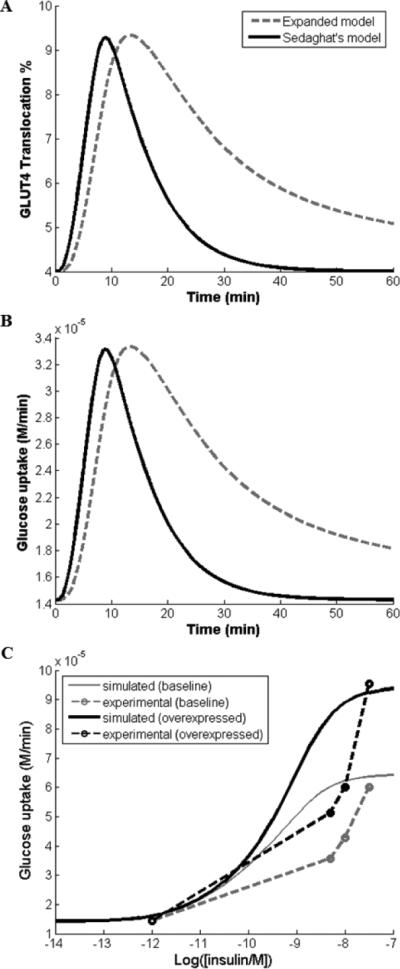
Figure 2.

Comparison of our expanded model (dashed line) and Sedaghat's original model (solid line).
A. GLUT4 translocation time response curve comparing the two models with a single insulin dose input of 0.1nM and run time of 60 min
B. Glucose uptake rates with a single insulin dose of 0.1nM and run time of 60 min
C. Insulin dosage response curve showing expected glucose uptake rates from an insulin dose of 10−12 M to 10−6 M. Comparison of simulated glucose uptake (solid lines) and experimental glucose uptake (dotted lines) as a result of AS160 overexpression. Experimental results were based on data from Baus et al. study and data points were presented as hollow circles in the figure.
