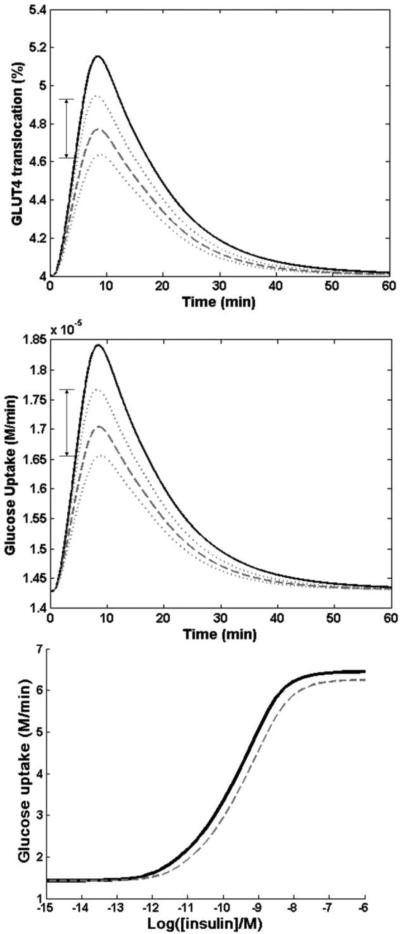
Figure 3.
Simulation of the effect of overexpression of PTP (2.8-fold) and PKC (3.0-fold), and underexpression of PI3K ( 2.8-fold). Recorded from our previous microarray data of Gyk KO with respect to Gyk WT mice.
A. GLUT4 translocation time response curves, Gyk KO (dashed and dotted lines) vs WT (solid line), with a single insulin dose input of 0.1nM and run time of 60 min. (p<0.05). Dotted lines represent the range of outputs for GLUT4 translocation % of Gyk KO, accounting for the standard error of the data reported in Rahib et al. (2007)
B. Glucose uptake level, Gyk KO (dashed and dotted lines) vs WT solid line), with a single insulin dose of 0.1nM and run time of 60 min. (p<0.05). Dotted lines represent the range of outputs for GLUT4 translocation % of Gyk KO, accounting for the standard error of the data reported in Rahib et al. (2007) C. Insulin dosage response curves (Gyk KO vs WT) showing expected glucose uptake levels from insulin dose inputs from 10−12 M to 10−6 M. (p<0.05)

