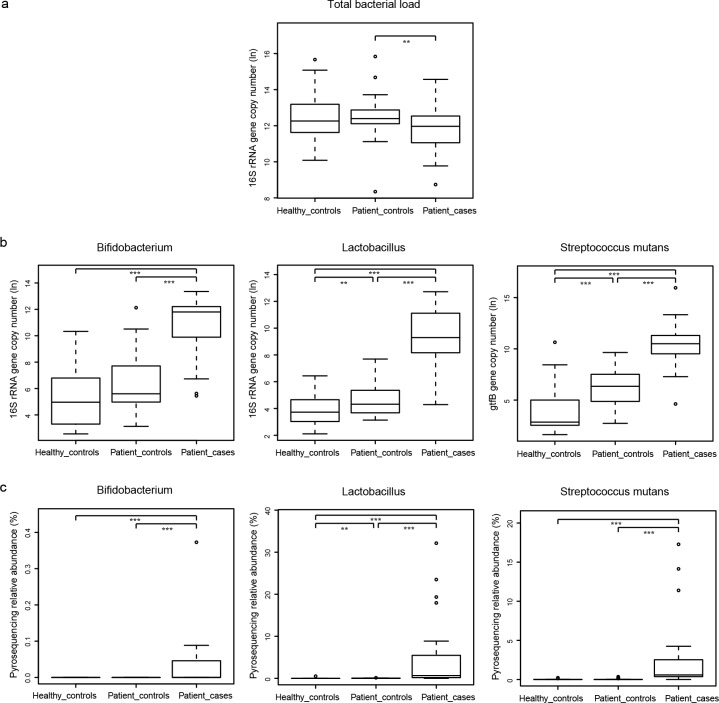
Fig 2. Boxplots for comparison of bacterial loads by qPCR and bacterial relative abundances by 454 pyrosequencing.
(a) Boxplot for total bacterial load. (b) Boxplots for the total loads of genera Bifidobacterium, Lactobacillus, and species Streptococcus mutans. (c) Boxplots for the pyrosequencing relative abundances of the same taxa as (b). Gene copy number shown above was transformed by natural logarithm (ln) and relative abundance was transformed by percent (%). * denotes P < 0.1; ** denotes P < 0.05; *** denotes P < 0.01.

