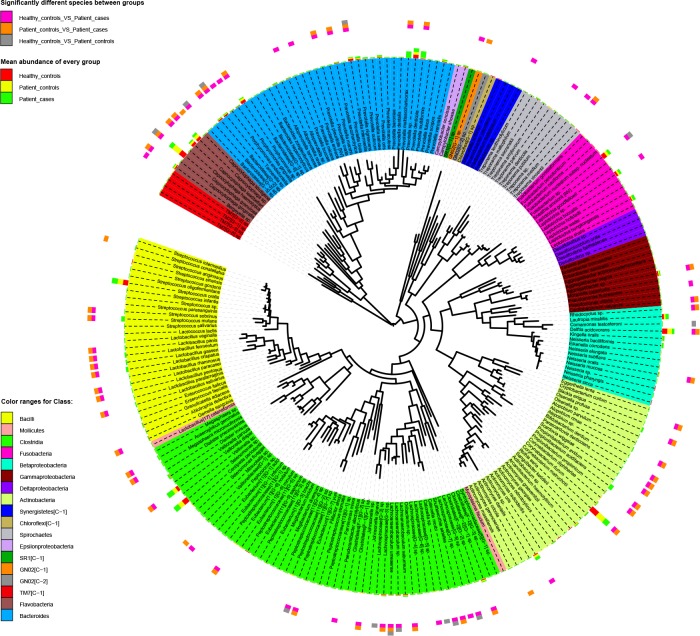
Fig 3. Maximum likelihood phylogenetic tree at the species level.
Inner loop displays species with color ranges for the class level (see color key at the bottom left); middle loop indicates mean relative abundance in each group (see color key at the top left); outer loop indicates significantly different species detected between groups (see color key at the top left). An online tool of iTOL was used to construct this tree.

