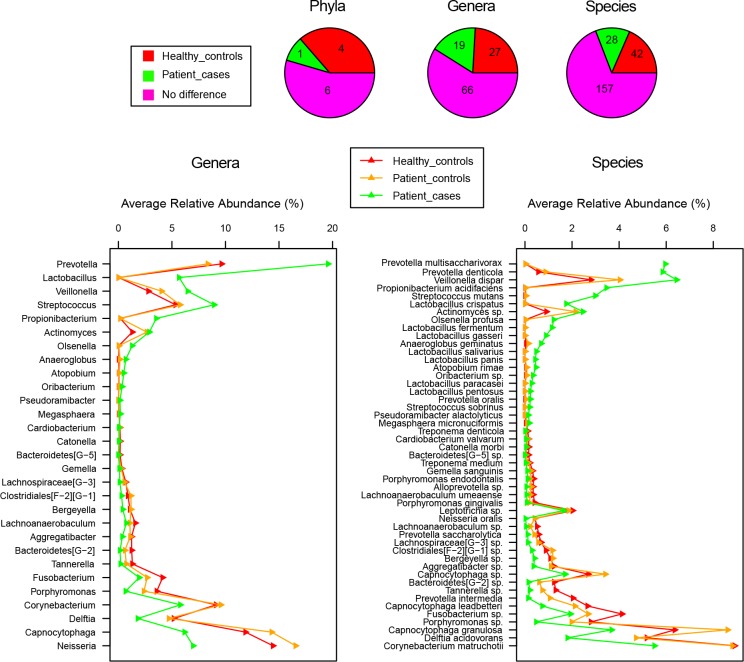
Fig 5. Distributions of abundance-based significant phyla, genera and species between health and root caries.
Pie charts display the counts distribution of significantly different taxa. Line charts sort significantly different genera and species in the order of magnitude of abundance change (≥0.1%) between Healthy_controls and Patient_cases.

