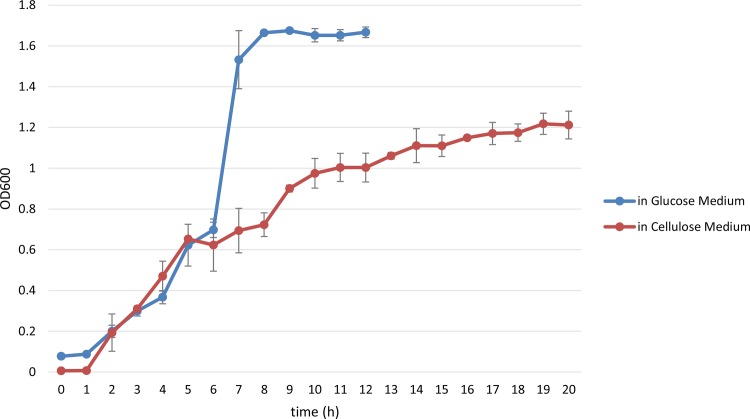
Fig 1. The growth curves of B. subtilis HH2 exposed to different carbon sources.
B. subtilis HH2 was cultured in cellulose or glucose medium following 1% inoculation at 37°C in a shaker at 150 rpm; the OD600 was measured every hour. Each graph represents the mean of three independent biological replicates grown on three different days. The error bars represent the standard deviations (SDs) of the optical density at each time point.

