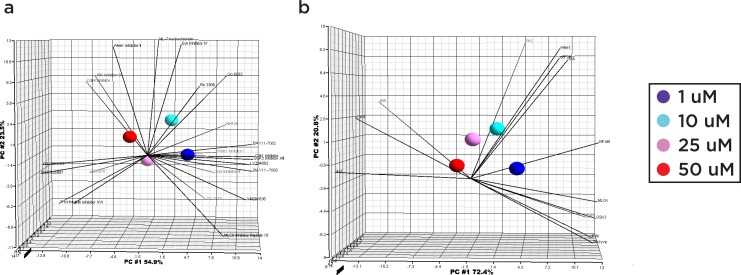
Fig 7. Principal component analysis of inhibitor/kinase dose response profiles.
Computed principal components are visualized with a Scree plot, with the top 3 principal components (PC #1, PC #2, PC #3) denoted by orthogonal axes and line segments denoting individual inhibitors or kinases. The first principal component contributes the most (54.5% for inhibitors and 70.5% for kinases) and is denoted by the horizontal axis. Spheres denote the composite response of a single dose category (1, 5, 25, 50 uM). A) Response profile of inhibitors. B) Response profile of kinases.

