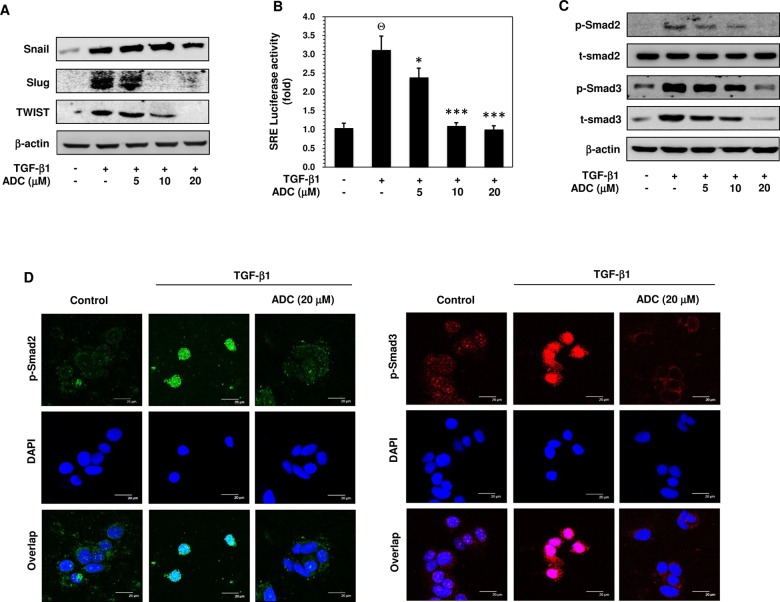
Fig 4. ADC inhibits TGF-β1-induced transcriptional activity of Smad2/Smad3.
(A) MCF-7 cells were pre-treated with ADC (5–20 μM) for 2 h prior to stimulation with TGF-β1 (20 ng/mL) for 24 h. Western blot analysis was performed to examine the protein expression levels of Snail, Slug, and TWIST with specific antibodies. β-actin was used as an internal loading control. (B) Cells were transfected with pGL3-SBE-4-Luc reporter construct, and then pre-treated with ADC (5–20 μM) prior to stimulation with TGF-β1 for 3 h. The luciferase activity was expressed as a relative value compared to that of the untreated cells which was set to 1-fold. (C) Western blot was performed to measure the total and phosphorylated levels of Smad2 and Smad3 proteins. (D) TGF-β1-induced nuclear translocation of phosphorylated Smad2 and Smad3 were examined by immunofluorescence analysis with confocal microscope. Cells were pre-treated with ADC (20 μM) for 2 h, and then incubated with TGF-β1 for 1 h. After treatment, cells were fixed, permiabilized, and incubated with Phos-Smad2 or Phos-Smad3 primary antibodies for overnight followed by FITC and TRITC secondary antibodies, respectively for 1 h. The cellular DNA was stained with DAPI (1 μg/mL) and images were captured by confocal microscope (magnification 200). Bars, 20 μm. The data reported as mean ± SD of three independent experiments. Θ P< 0.001, significant difference from control and TGF-β1 alone treated group. *P< 0.05, **P< 0.01, and ***P< 0.001 were significantly different from TGF-β1 alone with the ADC treatment groups.

