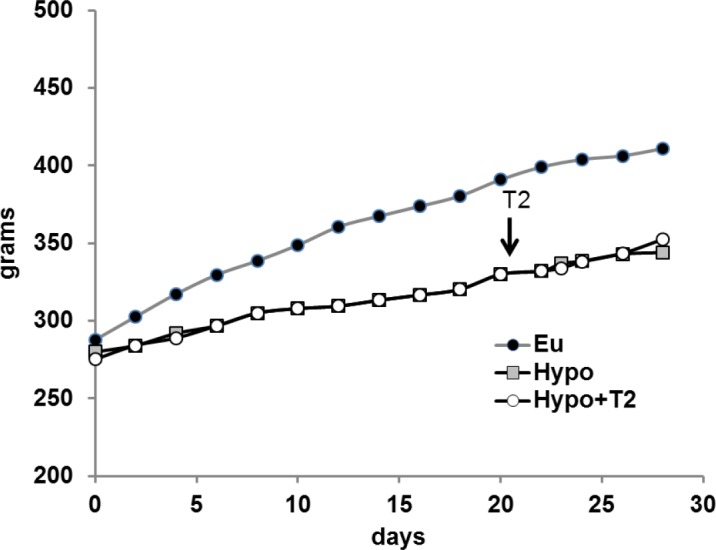
Figure 1. Growth curve of euthyroid (Eu), hypothyroid (Hypo), and hypothyroid rats treated with T2 (Hypo+T2).

The arrows indicate initiation of T2 treatment. Although the standard error for each data point is less than 2%, these bars were omitted for a better representation.
