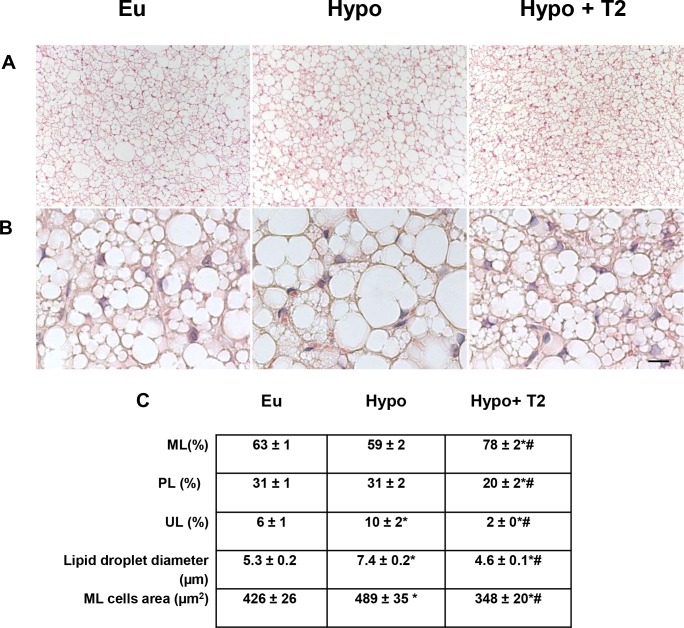
Figure 2. Effects of hypothyroidism and T2 administration to Hypo rats on BAT morphology.
(A) Representative tissue sections showing different cellular shapes within BAT parenchyma, and (B) the different distribution of lipid droplets inside the multilocular (ML) adipocytes. Scale bars: 60 μm in (A); 10 μm in (B). (C) Quantification of ML, paucilocular (PL), and unilocular (UL) cells within the tissue, as well as lipid droplet diameters and areas of ML adipocytes *P<0.05 versus Eu; #P<0.05 versus Hypo.

