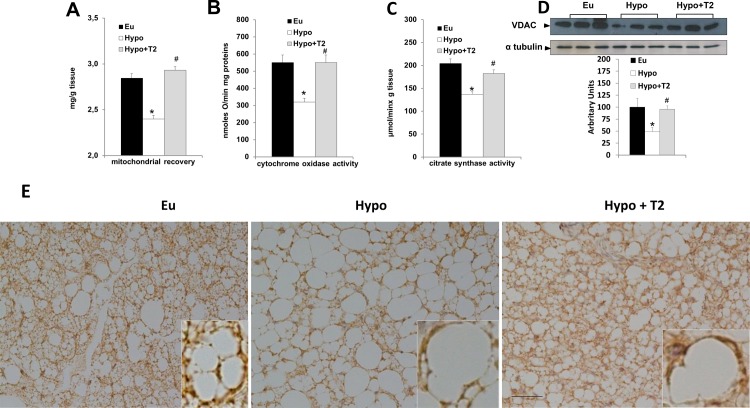
Figure 5. Effects of hypothyroidism and T2 administration to Hypo rats on tissue mitochondrial content and oxidative capacity.
(A) Mitochondrial protein/100 mg tissue, (B) cytochrome oxidase (COX) activity, (C) citrate synthase activity, and (D) VDAC1 content detected in whole BAT lysates. Data in the bar chart are represented as means ± standard error of the mean from five independent experiments, each performed in duplicate. *P<0.05 versus Eu; #P<0.05 versus Hypo. (E) Representative COX IV immunoreactivity in BAT. Scale bar: 40 μm.

