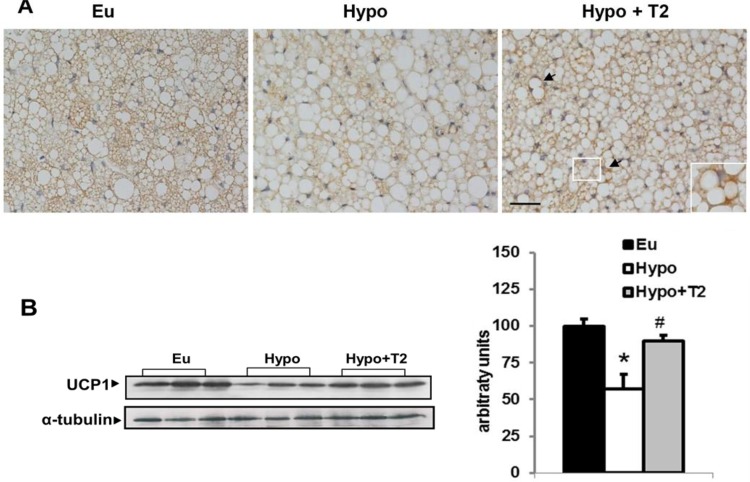
Figure 8. Effects of hypothyroidism and of T2 administration to hypothyroid rats on BAT UCP1 content.
(A) Immunohistochemistry for UCP1 in representative sections of BAT. Inset: enlargement of the framed area showing an intensely stained PL cell (arrow). Scale bar represents 40 μm.
(B) Representative western blots and quantification of the signals of UCP1 protein levels detected in the whole lysate and at the mitochondrial levels. For total lysate, each lane contained 15 μg of protein from a single rat. Bar charts show quantifications of the signals (expressed relative to the value for the euthyroid controls obtained from 5 rats). *P<0,05 vs Eu, #P<0,05 vs hypo

