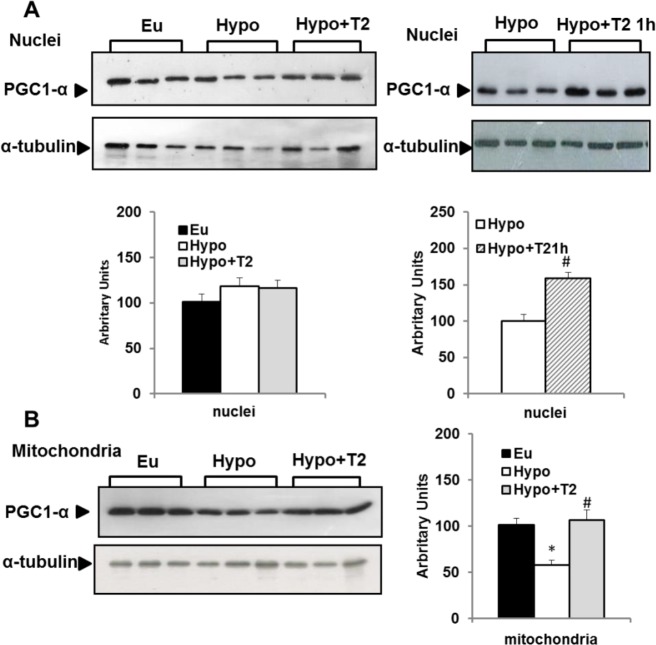
Figure 9. Effects of hypothyroidism and of T2 administration to Hypo rats on nuclear and mitochondrial PGC1-α content.
Representative western blots and quantification of the signals are shown. Each lane contained 15 μg of protein from a single rat. Bar charts show quantifications of the signals (expressed relative to the value for the Euthyroid controls obtained from 5 rats). Values represent mean ± SE * P <0.05 vs. Eu. #P<0.05 vs. Hypo.

