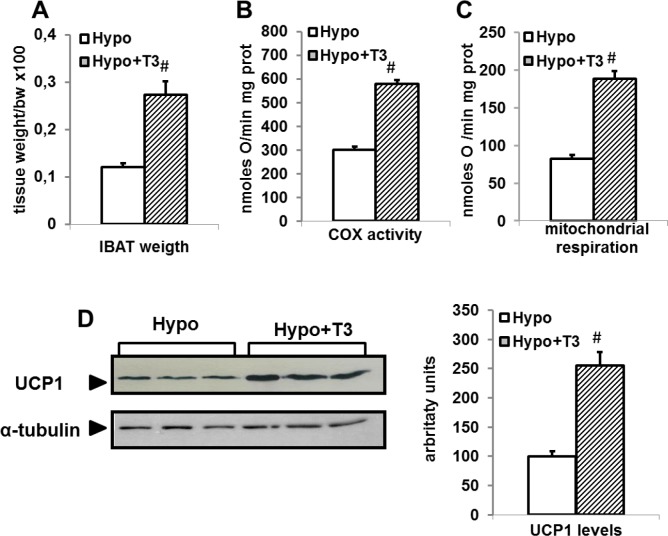
Figure 10. Effects of T3 administration to Hypo rats on (A) BAT weight, (B) Cytochrome oxidase (COX) activity, (C) mitochondrial respiration, and (D) UCP1 content in Hypo rats.
(D) Representative Western blots and histogram of UCP1 protein levels in whole lysates (15 μg of protein/rat/lane). The bar charts shows blot signal quantification relative to Eu (n = 5 rats). *P<0.05 versus Hypo.

