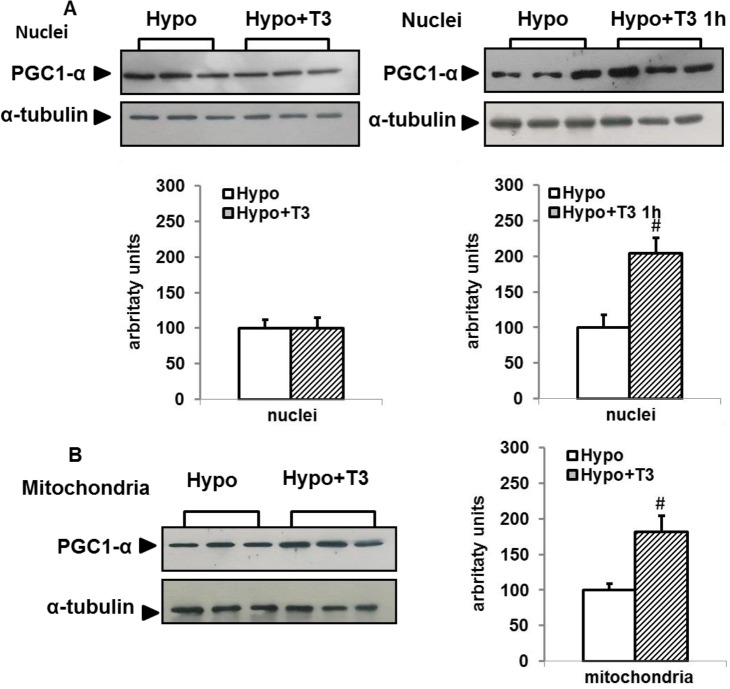
Figure 11. Effects of T3 administration to Hypo rats on nuclear and mitochondrial PGC1-α content.
Representative Western blots and respective histograms of respective lysates. Each lane was loaded with 15 μg protein from a single rat. The bar charts show blot signal quantification relative to Hypo (n = 5 rats). Values represent mean ± standard error of the mean. #P<0.05 versus hypo

