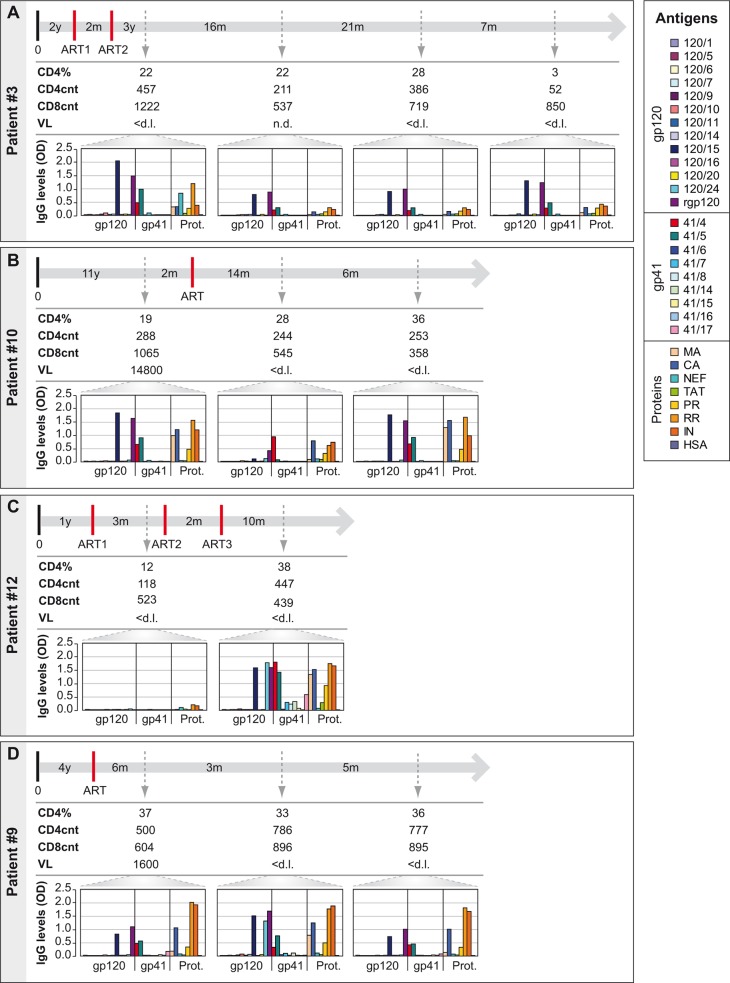
Fig 5. Monitoring of CD4+ and CD8+ T-cell counts, viral loads and IgG reactivity profiles to HIV-1 clade C-derived proteins and peptides during infection and treatment.
Displayed are percentages of CD4+ T-cells, CD4+ and CD8+ T-cell counts, viral loads and levels of IgG antibodies to HIV-1 clade C-derived proteins and peptides (the box shows color codes of antigens and peptides) over time (top line) for patients with variable antibody reactivity profiles (A: patient #3; B: patient #10; C: patient #12; D: patient #9). Abbreviations: 0, 1st positive test / 1st visit; ART, antiretroviral therapy; ART1, ART2 and ART3 denote different ART regimens; y, years; m, months; VL, viral load; n.a., not available; n.d., not done; <d.l., below detection limit; OD, optical density; Prot., Proteins; MA, matrix; CA, capsid; NC, nucleocapsid; PR, protease; RR, reverse transcriptase+RNAseH; IN, integrase; HSA, human serum albumin.

