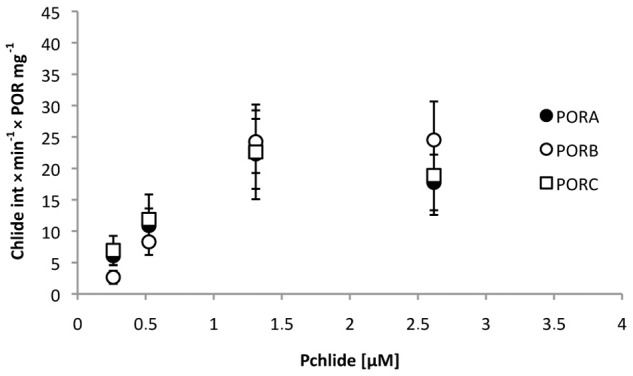
Fig 8. Relative activity of the POR proteins, defined as the increase in Chlide fluorescence intensity per time unit and per protein concentration (in mg), calculated for different Pchlide concentrations.

Calculations were performed for series of fluorescence spectra measured at room temperature (e.g. S2 Fig.). POR concentration in a single experiment was between 1 and 2.75 μM; NADPH concentration: 0.05 mM. Error bars are SD of two independent series of fluorescence spectra.
