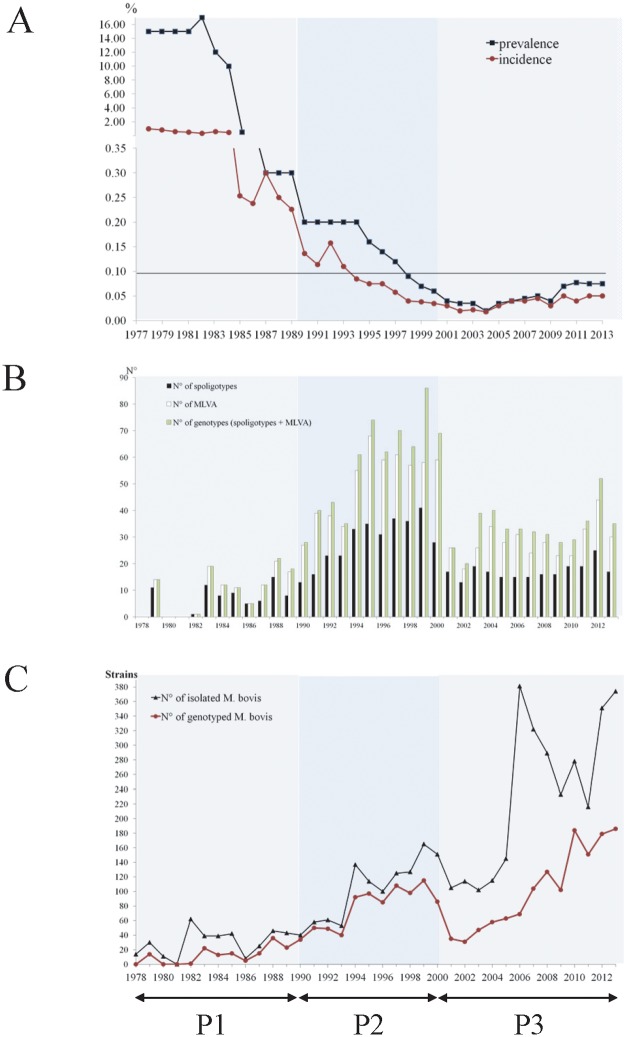
Fig 2. Evolution of the prevalence and the incidence rate of bTB (A), of the different strain profiles number (B) and yearly evolution of the strain collection (C) of M. bovis in France from 1978 to 2013.
A: On the abscissa are represented the years, on the ordinate, the percentage of incidence (◼) and prevalence (●). Black line cutting the ordinate axe at 0.1% represents the limit under which an EU country is considered free of bTB. Below the graph, three lines (P1; P2; P3) represent the three periods studied. B: In black bars, spoligotypes, in white bars, MLVA profiles, in green bars, the association of both methods. C: Yearly evolution of the number of strains collected (Black) and spoligotype-MLVA identification (Pink) of the 4,654 M. bovis strains received in the National Reference laboratory between 1978 and 2013. For both graphs, lines represent the three studied periods (P1; P2; P3).

