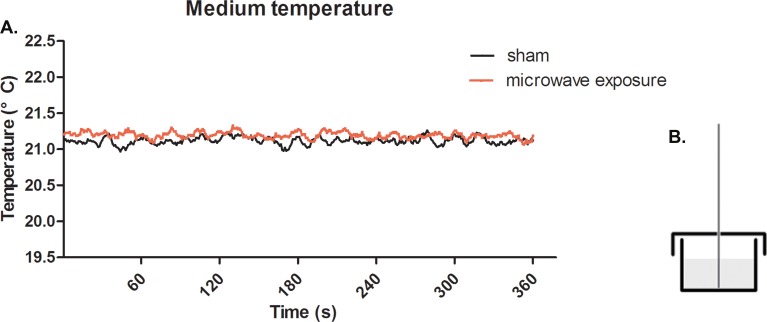
Fig 2. Real-time temperature detection of medium under 2.856 GHz microwave exposure at SAR of 4 W/kg.
(A) Solid red line represents the temperature changes under microwave exposure and the solid black line represents the sham group in parallel to the exposure group (in the absence of microwave radiation). (B) Schematic diagram describing the geometry of temperature measurements.

