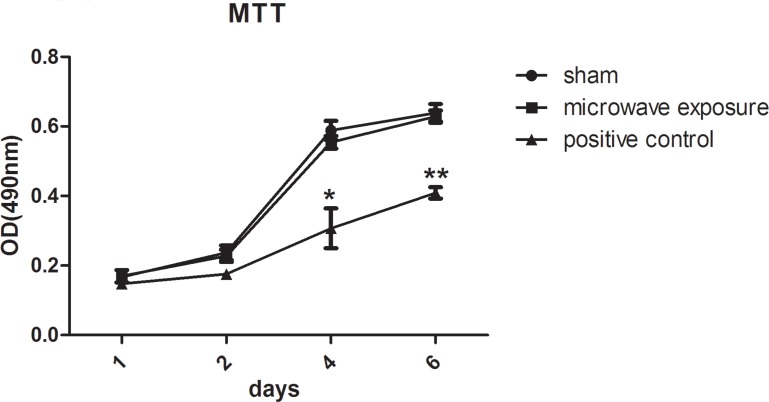
Fig 3. MSC proliferation detected with MTT assays after 2.856 GHz microwave exposure at SAR of 4 W/kg (n = 3, each group contained three cell samples from three different mice).
Solid line with black squares represent the microwave exposure group, solid line with points represent the sham group in parallel to the exposure group in the absence of microwave radiation, and the solid line with black triangles represent the positive control irradiated with 2.0 Gy 60Co γ-ray. Compared with sham group, cell viability decreased significantly at day 4 and day 6 with the OD490nm values of 0.307 ± 0.058 (n = 3, P = 0.023, statistical power >0.999) and 0.409 ± 0.016 (n = 3, P = 0.001, statistical power >0.999) after γ-ray radiation. However, there were no significant differences in cell viability between sham and microwave exposures.

