
Figure 1.
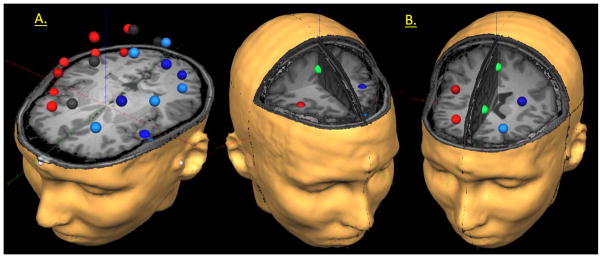
Representative Example of the 29-node Regional Source Model and Current Regions of Interest. (A) For each participant, a 29-node (grid-point) model was fitted to their MRI following coregistration, and this model was used to estimate regional neural activity during the time estimation task. In (A) above, the model can be seen overlaid on the MRI of a participant with ADHD. The different colors are only meant to aid in visually grouping the regional sources corresponding to similar brain areas. Note that the regional sources are spaced equidistant apart, and that each represents activity over an extended cortical area (i.e., > 1cm3). Thus, the time series of each node reflects the average neural activity over that brain region, and not the amount of activation at a precise neuroanatomical coordinate (e.g., a voxel in Talairach space). (B) Regions of interest (ROI) for the current study are shown in reference to two different axial slices to highlight their particular locations. On the left, a more superior axial slice illustrates the center of the right anterior frontal cortices ROI (dark red), the left anterior frontal cortices ROI (dark blue), and the supplementary motor area (SMA; green) ROI. To the right, an inferior axial slice highlights the center of the left (light blue) and right (light red) prefrontal cortices ROI (PFC), and the anterior cingulate cortices ROI (ACC; green). ROIs were chosen a priori based on previous studies of timing function in healthy participants.