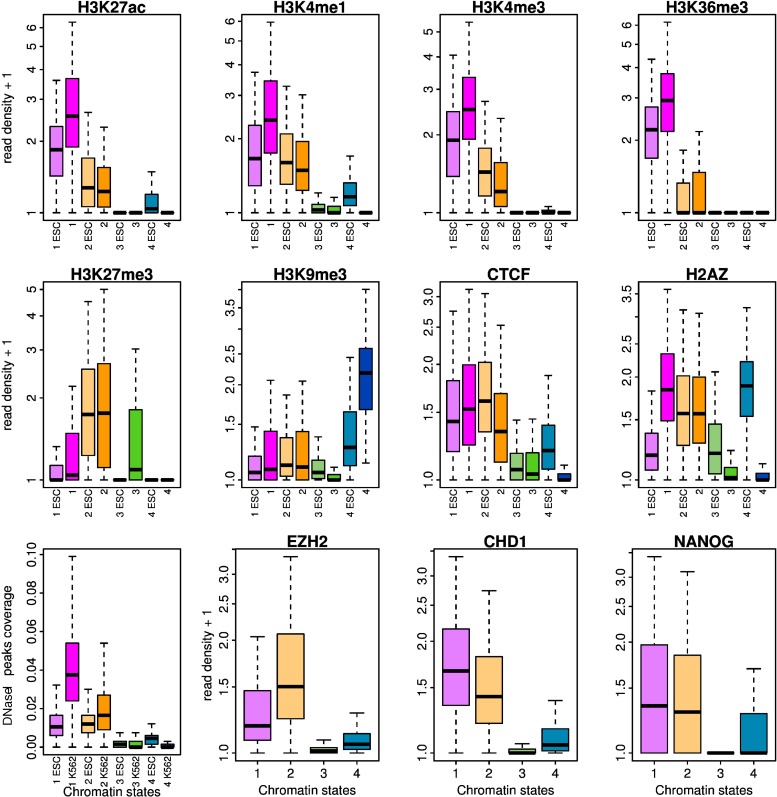
Figure 2. (First two rows) Repartition of epigenetic marks in the four prevalent chromatin states of H1hesc cell line: EC1 (light pink), EC2 (light orange), EC3 (light green), EC4 (light blue) and of differentiated cell lines: C1 (pink), C2 (orange), C3 (green), C4 (blue).
Boxplots of the decimal logarithm of histone mark ChiP-seq read density in 100 kb non-overlapping windows per chromatin state. (Third row) Boxplots of the coverage of DNase1 hypersentive peaks in 100 kb non-overlapping windows per chromatin state in H1hesc and K562 cell lines and the decimal logarithm of EZH2, CHD1 and NANOG ChiP-seq read density in 100 kb non-overlapping windows per chromatin state in H1hesc cell lines. Same color coding as above.

