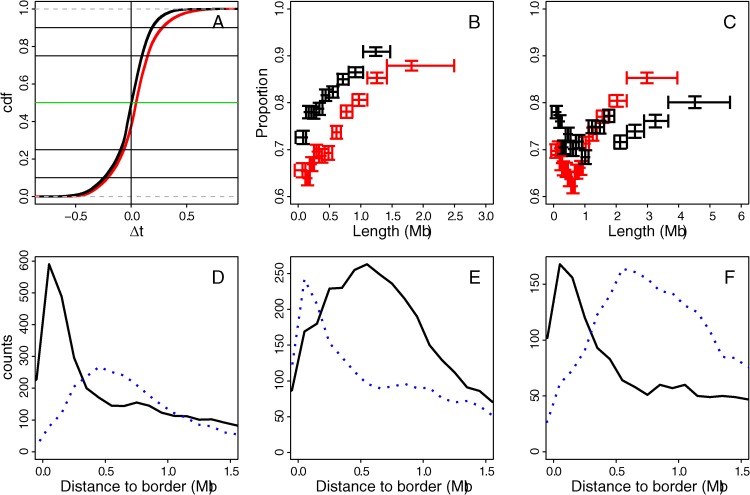
Figure 6. (A) Cumulative distribution function (cdf) of MRT difference Δt between two cell lines: Δt = MRT(Nhdfad) − MRT(H1hesc) (red) and Δt = MRT(Nhdfad) − MRT(K562) (black).
Horizontal lines mark from bottom to top the first decile, first quartile, median, last quartile and last decile, respectively. (B) Proportion of 100 kb windows in C1+C2 blocks that have a conserved MRT (∣Δt∣ < 0.2) with respect to block length: H1hesc blocks with MRT compared to Nhdfad (red) and K562 blocks with MRT compared to Nhdfad timing (black). (C) Same as (B) for C3+C4 blocks. (D) Histogram of distances to H1hesc U-domain borders for loci that have a Δt = MRT(Nhdfad) − MRT(H1hesc) > 0.2 (line) and < −0.2 (dots). (E) Histogram of distances to Nhdfad U-domain borders for loci that have a Δt = MRT(Nhdfad) − MRT(H1hesc) > 0.2 (line) and < −0.2 (dots). (F) Histogram of distances to K562 U-domain borders for loci that have a Δt = MRT(Nhdfad) − MRT(K562) > 0.2 (line) and < −0.2 (dots).

