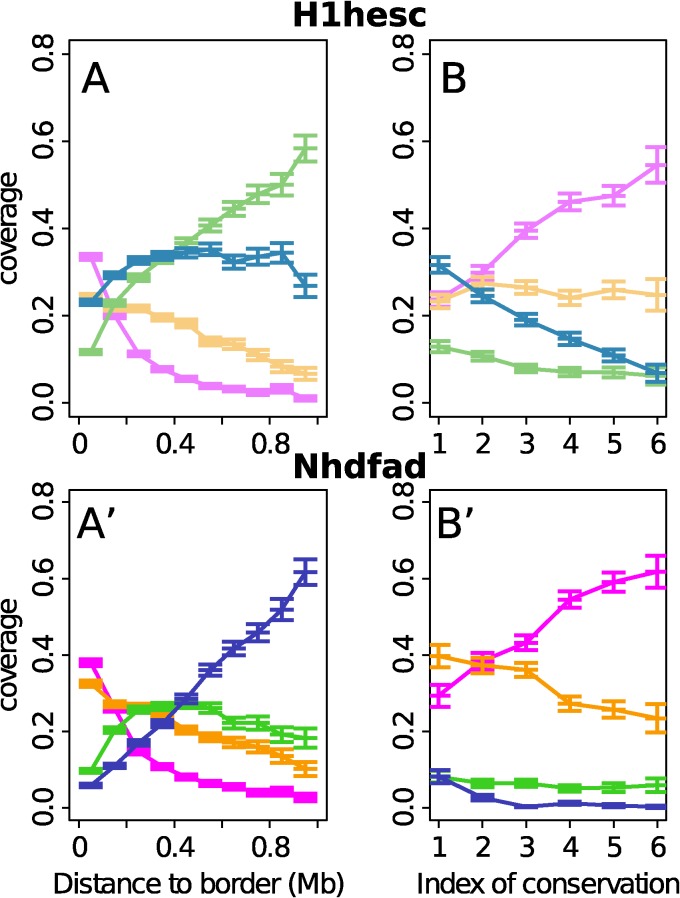
Figure 7. Distribution of chromatin states inside replication timing U-domains of H1hesc and Nhdfad.
(A) Mean coverage of chromatin states with respect to the distance to the closest U-domain border in the H1hesc cell line. (B) Mean coverage of ESC chromatin state in the 100kb window containing a U-domain border with respect to the conservation index n of the U-domain border (Materials and Methods). (A’, B’) same as (A, B) for the Nhdfad cell line. Same color coding as in Fig. 2.

