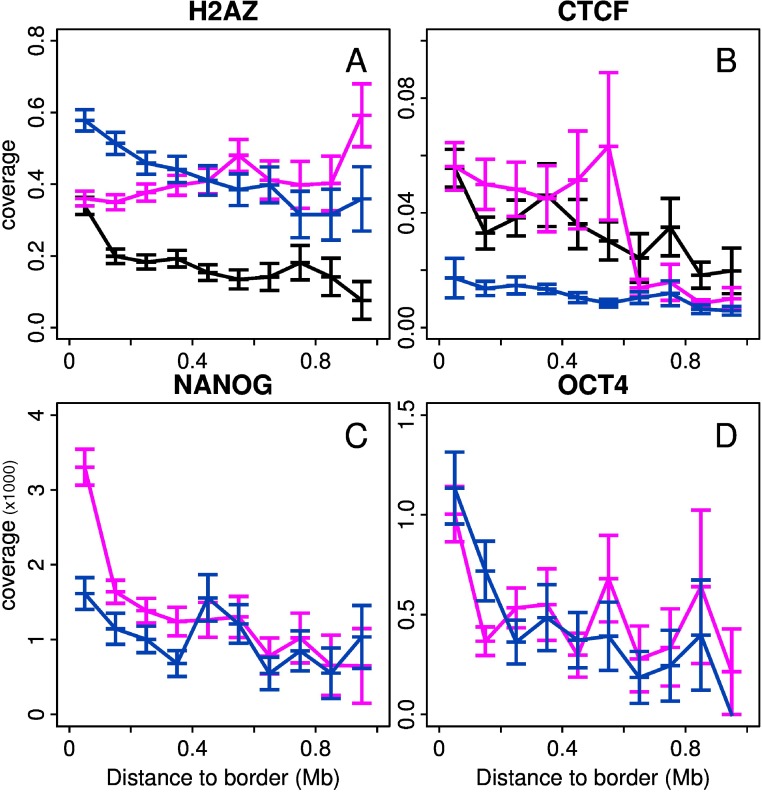
Figure 8. Epigenetic marks enrichment in specific MRT U-domains of H1hesc and Nhdfad.
(A) Mean coverage of H2AZ enriched intervals with respect to the distance to the closest U-domain border specific to the cell line. The different colors correspond to specific U-domains of Nhdfad (black), specific U-domains of H1hesc whose border is in EC1 or EC2 (red) and specific U-domains of H1hesc whose border is in EC4 (blue). (B), (C) and (D) are as (A) for respectively CTCF, NANOG anf OCT4. Note that in (C) and (D) coverage are per thousand.

