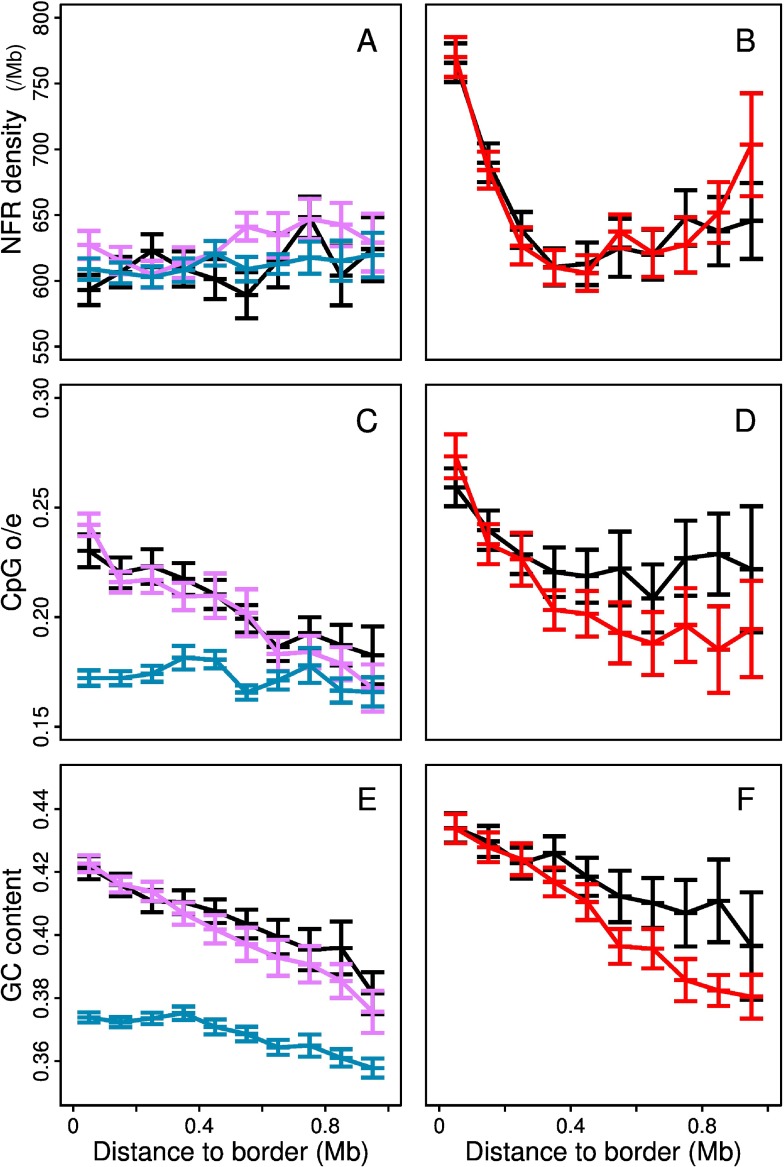
Figure 9. Sequence characterictics of MRT U-domains of H1hesc and Nhdfad.
(A) Density of nucleosome free regions (NFRs) with respect to the distance to the closest U-domains border specific (n = 1) to the cell line. The different colors correspond to specific U-domains of Nhdfad (black), specific U-domains of H1hesc whose border is in EC1 or EC2 (red) and specific U-domains of H1hesc whose border is in EC4 (blue). (B) Density of (NFRs) with respect to the distance to the closest conserved (n = 6) U-domains border. (C) same as (A) for the CpG o/e. (D) same as (B) for the CpG o/e. (E) same as (A) for the GC content. (F) same as (B) for the GC content.

