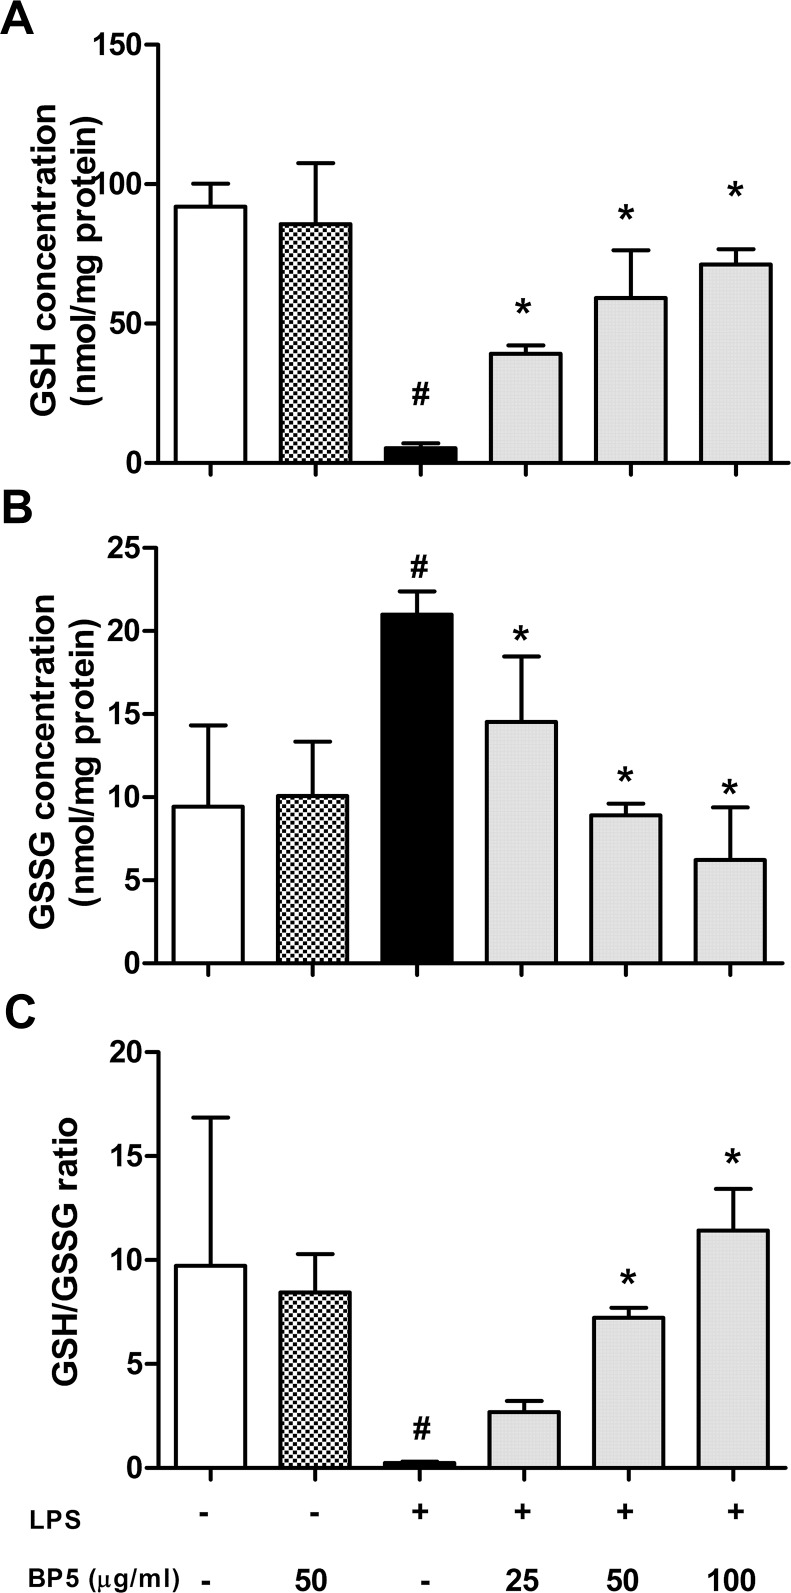
Fig 4. BP5 modulated intracellular GSH, GSSG and the GSH/GSSG ratio in the LPS-stimulated DCs.
DCs (1×10⁶ cells/ml) were pretreated with or without BP5. After 2 h, the cells were stimulated with LPS (100 ng/ml) or not for 22 h. The levels of (A) GSH, (B) GSSG and (C) GSH/GSSG ratio in the cells were measured as described in Materials and Methods. Data shown are the means ± SD of three samples. *P < 0.05 in comparison with the LPS-only group; # P < 0.05 in comparison with the untreated group. All results are representative of three independent experiments.

