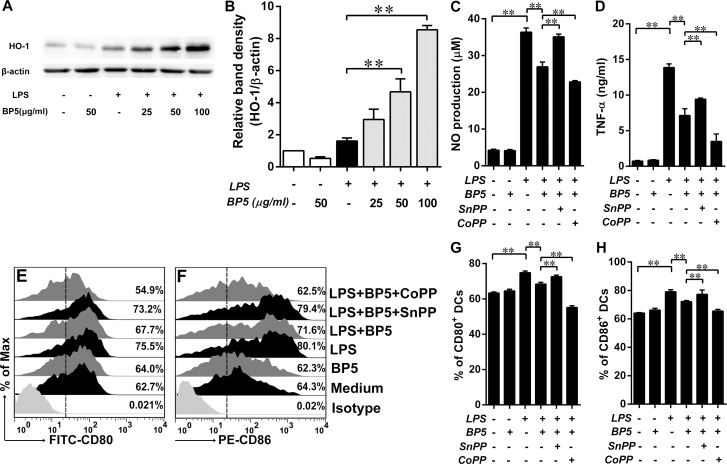
Fig 7. BP5 upregulated the expression of HO-1 protein in the LPS-induced DCs.
DCs (1×10⁶ cells/ml) were treated with the indicated concentrations of BP5 for 2 h, and then incubated with or without LPS (100 ng/ml) for 22 h. (A) HO-1 levels were assessed by western blotting. (B) Quantification of the blots. (C-H) DCs were pretreatment with BP5 (100 μg/ml) in the presence or absence of Snpp (25 μM) or Copp (50 μM) for 2 h, and then incubated with or without LPS (100 ng/ml) for 22 h. (C) Supernatants were collected and NO production was measured using the Griess reagent. (D) TNF-α released from supernatants was measured by ELISA. DCs were harvested and the expressions of CD80 (E, G) and CD86 (F, H) were analyzed by FACS. Data shown are the means ± SD of three samples. *P < 0.05; **P < 0.01. All results are representative of three independent experiments.

