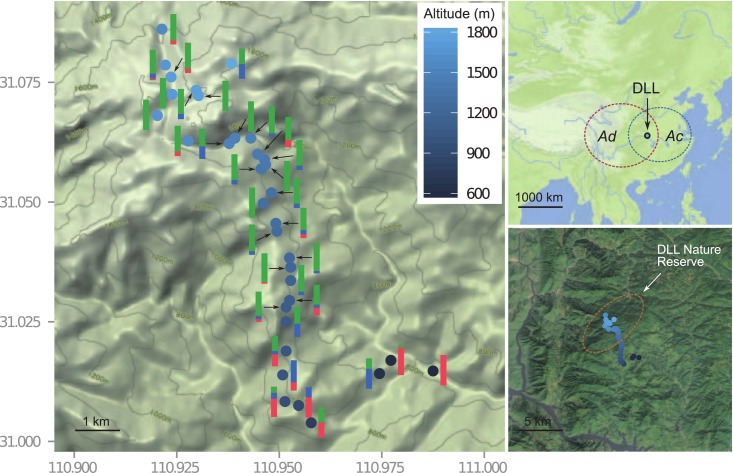
Fig 1. Sampling scheme of Actinidia chinensis complex in the Dalaoling (DLL) population.
The vertical bar with different color composition shows the variation of ploidy levels in each sampling site (diploid: pink; tetraploid: sky blue; hexaploid: green). The top-right small map shows the location of DLL population in China, while both dashed-line ellipses show the potentially geographical distribution of both varieties Ac and Ad. The bottom-right map shows the DLL Nature Reserve. Details on the population and frequency of ploidy individuals are given in S1 Table. The map base was generated using free data sources from the National Geomatics Center of China.

