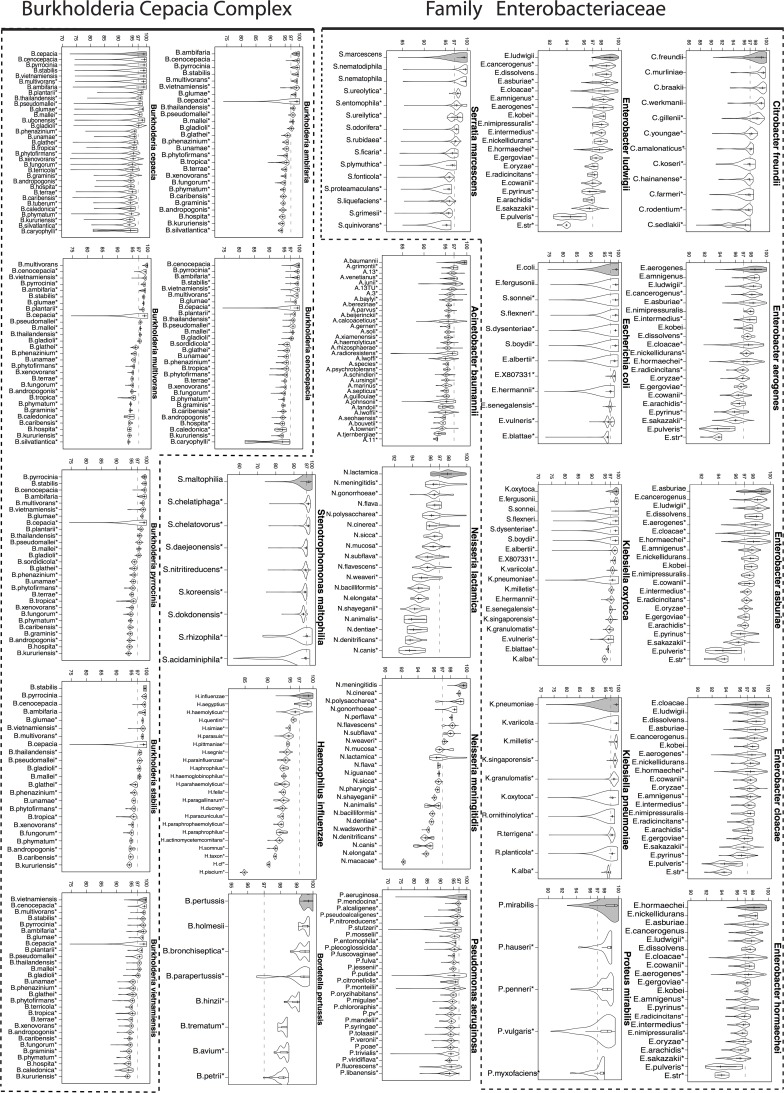
Fig 4. 16S rRNA percent identity within and between species (gram-negative bacteria).
Distributions (shown as violin plots) of 16S rRNA percent identity (y-axis of each figure) of pairs of training set sequences belonging to the same (gray) and different species for select gram-negative bacteria. 97% identity, the traditional species level cutoff, has been marked for reference. Species for which sequence variability between sequences from the same species was significantly higher than between those from different species are marked with a * (Wilcoxon test one-sided p-value<0.0001).

