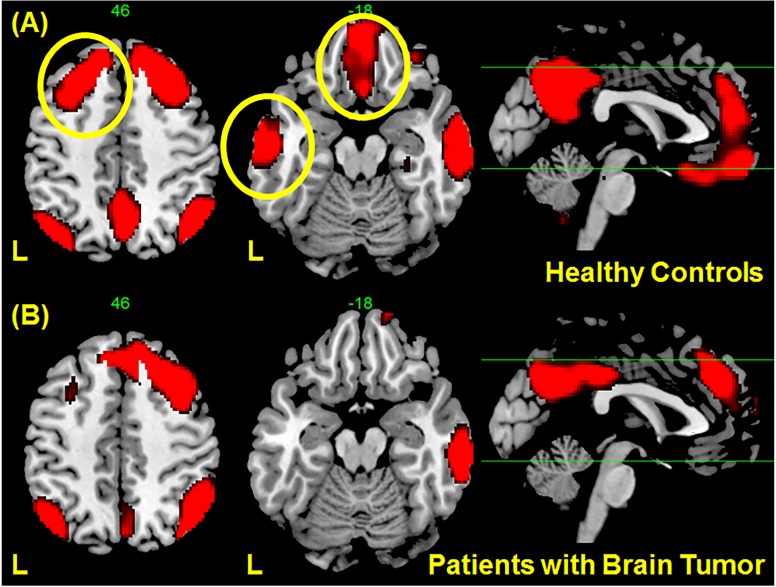
Fig 3. Regions correlated with the right angular gyrus (Fig. 2C) obtained using seed-based connectivity analysis in (A) healthy controls and (B) patients with gliomas.
Correlations in several regions in the left hemisphere, indicated by yellow circle in (A), are no longer significant in patients with gliomas although only the region in the middle temporal gyrus showed statistical significance. The maps showed voxels with t values < 3.5.

