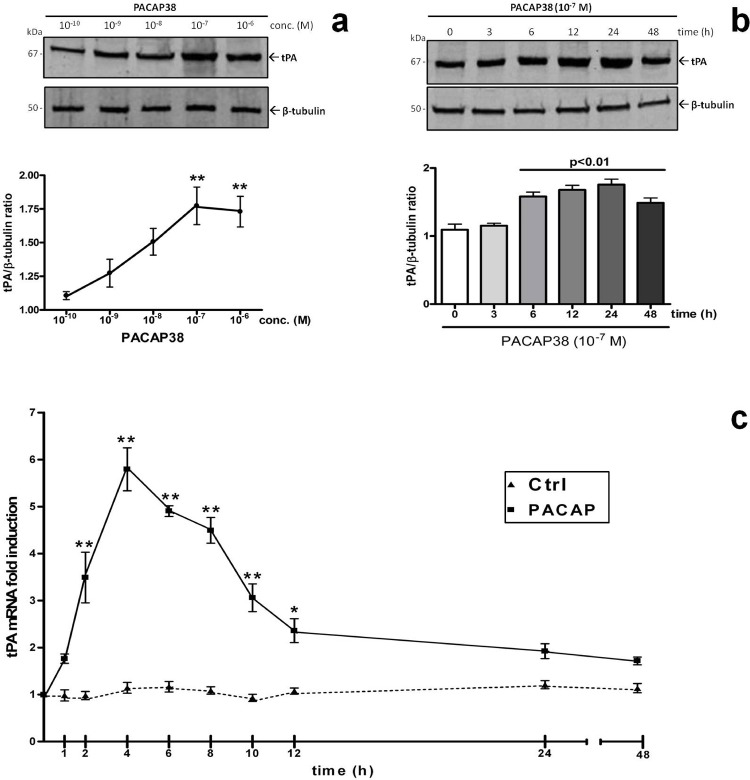
Fig. 1. Dose- and time-dependent effects of PACAP on tissue plasminogen activator (tPA) mRNA and protein expression.
Representative immunoblots and densitometric analyses (a – b) showing the effects of increasing concentrations of PACAP38 (10−10M to 10−6M, respectively) or (a) of a single concentration of the peptide (10−7M) on tPA protein expression at different time points (0, 3, 6, 12, 24, 48h). Protein extracts (20μg) obtained from rat RT4-D6P2T cultures grown as described were separated by SDS-PAGE and transferred to nitrocellulose membranes. Then, membranes were incubated using a rabbit anti-tPA (1:300, sc-15346, Santa Cruz Biotechnology) and a rabbit anti-β-tubulin antibody (H-235, cat n. sc-9104, Santa Cruz Biotechnology; 1:500) and scanned with an Odyssey Infrared Imaging System, as described in Materials and Methods section. Densitometric analyses were performed using the ImageJ software and values obtained were normalized to β-tubulin, which was used as loading control. Results are expressed as the average ratios ± S.E.M. from at least three independent determinations. *p<0.05 or **p<0.01 Vs untreated control or t0, as determined by One-way ANOVA followed by Dunnett’s post-hoc test. Kinetics of tPA mRNA expression in untreated cells (Ctrl) or following treatment with 10−7M PACAP38 at different times (0, 1, 2, 4, 6, 8, 10, 12, 24 and 48h, respectively) as determined by quantitative real time PCR analyses (c). Results are presented as mean fold changes with respect to Ctrl at the same experimental time ± S.E.M. Fold changes of tPA gene expression were obtained after normalization to the endogenous ribosomal protein S18 (housekeeping gene) and then calculated using the comparative ΔCt method. Baseline expression levels of the control group (Ctrl) were set to 1. Experiments were performed three times independently. *p<0.05 or ***p<0.001 vs Ctrl at the same experimental time, as determined by ANOVA followed by Dunnett’s post-hoc comparison.

