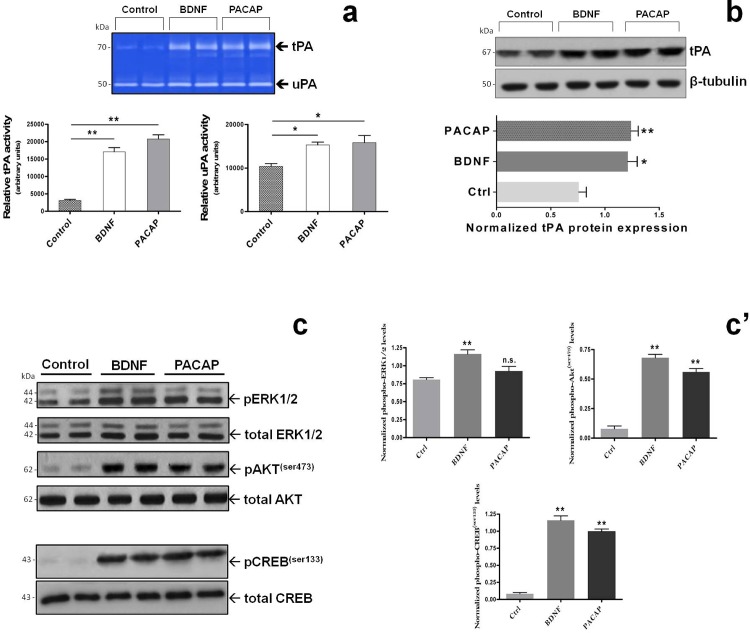
Fig. 3. PACAP- and BDNF-mediated induction of tPA expression and activity involves both the MAPKErk1/2 and Akt/cAMP-responsive element binding protein (CREB) signaling pathways.
Representative zymographic (a) and Western blot analyses (b) demonstrating the effects of 10−7M PACAP or 2x10⁻⁹M BDNF treatment on tPA and uPA activity (a) and tPA protein expression (b) in RT4-D6P2T cells after 24h. tPA and uPA activities were determined by zymography as detailed in MATERIALS AND METHODS. The representative picture shows lytic areas (white bands) on a Coomassie-stained gel (blue background) that correspond to the predicted molecular weight for tPA (64-70kDa) and uPA (~50kDa). Bar graphs depicted below the gel indicate the relative activity of each plasminogen activator, measured as the mean band intensity obtained from at least three separate determinations and calculated using the ImageJ software. *p<0.05 or **p<0.01 Vs Control; ANOVA followed by Dunnett’s post-hoc test. (c and c’) Activation of the MAPKErk1/2 and Akt/CREB signalling cascades was assessed by measuring Erk1/2, Akt and CREB phosphorylation at the indicated phospho-sites using the same procedures described in Fig. 1. Relative activation was calculated by normalizing each phospho-protein level over the corresponding unphosphorylated protein, which also served as loading control. Each plotted result represents the mean ± SEM from three separate experiments. **p<0.01 Vs Control; ANOVA followed by Dunnett’s post-hoc test. n.s. = not significant.

