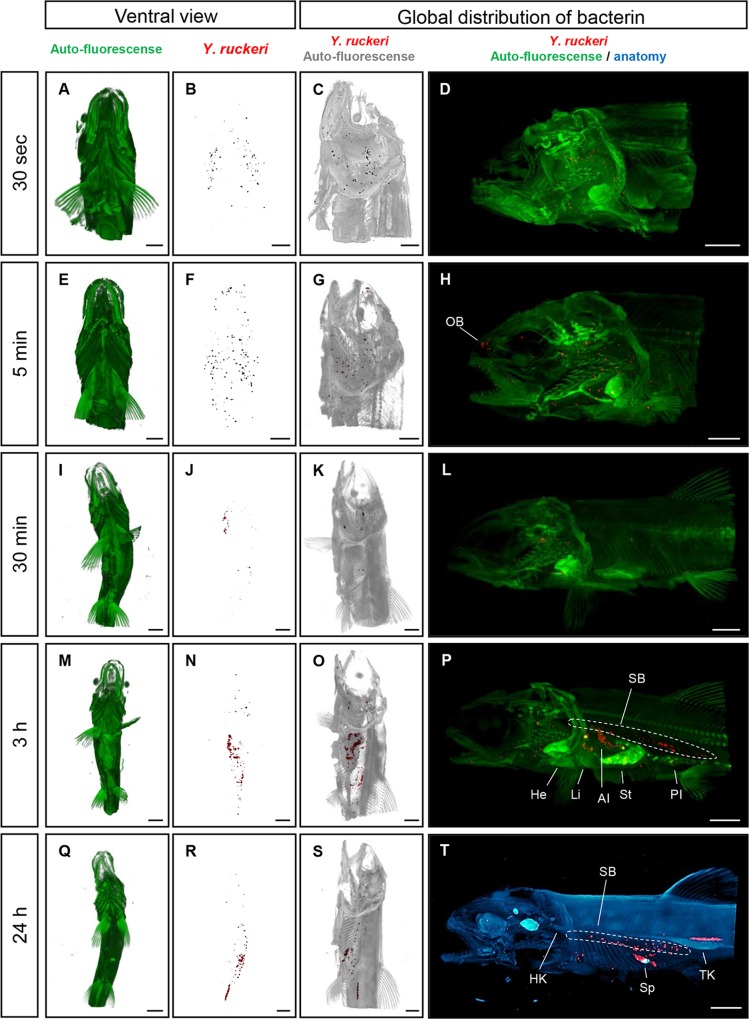
Fig 1. Overview of the 3D spatial distribution of the Y. ruckeri bacterin over time in rainbow trout fry.
(A, E, I, M and Q) shows a ventral view of the trout fry, the anatomy of the fish is trout based on detection of autofluorescence (green). (B, F, J, N and R) The red spots showing specifically stained Y. ruckeri bacterin in the fry shown in A, E, I, M and Q. (C, G, K, O and S) showing specifically stained Y. ruckeri bacterin and the gray color is based on autofluorescent showing the trout anatomy. D, H, L, and P are overlaid images of autofluorescent (green) showing the anatomy and the specific stained Y. ruckeri bacterin (red). The blue color showing the anatomy of the trout based on transmission light and red color demonstrating the distribution of the bacterin. Bar indicates 2 mm. He, heart; HK, head kidney; AI, anterior intestine; Li, liver; OB, olfactory bulb; PI, posterior intestine; SB, swim bladder; St, stomach; Sp, spleen and TK, trunk kidney.

