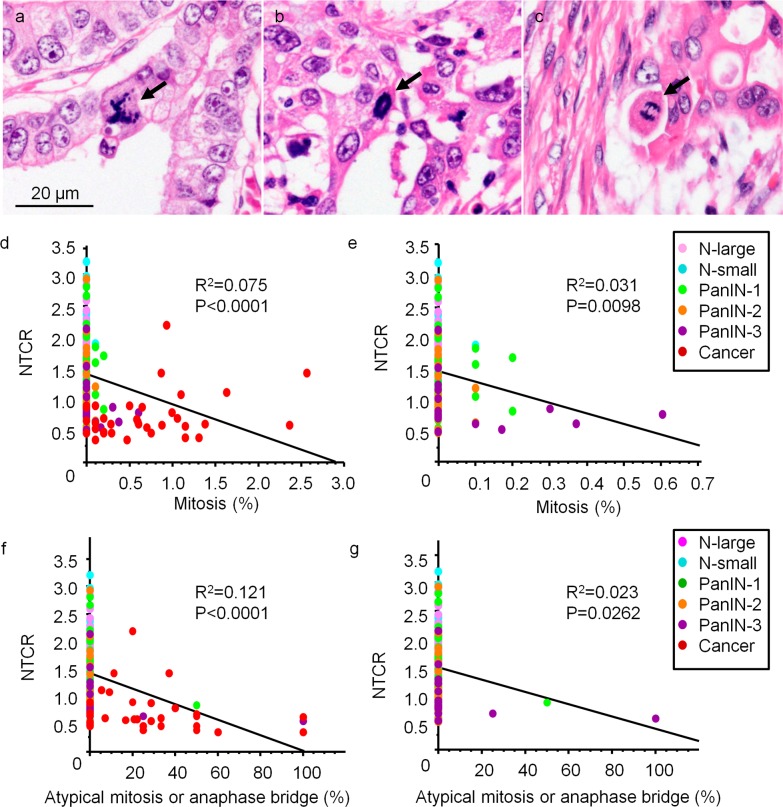
Fig 2. Relationship between telomere length and presence of atypical mitotic figures including anaphase bridges.
(a-c) Representative atypical mitotic figures. Arrows indicate multipolar mitosis (a), ring mitosis (b), and an anaphase bridge (c). (d and e) Correlation between NTCR and mitosis for the lesions as a whole (d) and overall minus cancer (e). Data are shown as the percentage of total mitotic Figures among the total cell count. (f and g) Correlation between NTCR and percentage of atypical mitoses or anaphase bridges among the lesions as a whole (f) and overall minus cancer (g). Data are shown as the percentage of atypical mitoses or anaphase bridges among the total number of mitotic figures.

