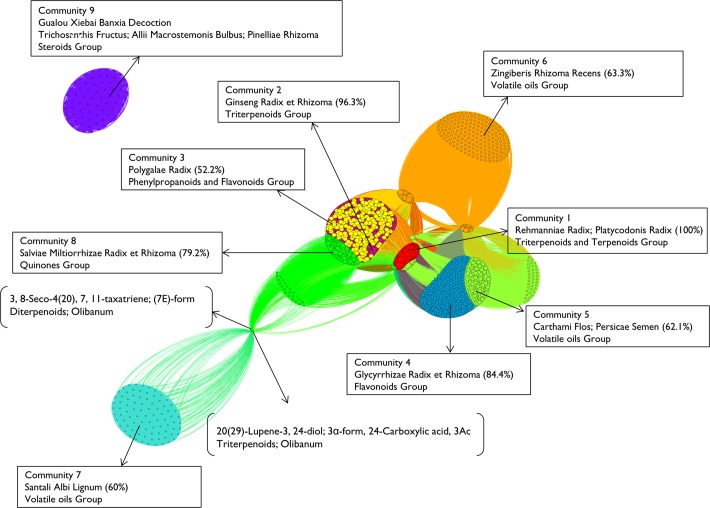
Fig 2. Chemical ingredients network.
Note: Node represents chemical ingredient, while node size corresponds to the weighted degree centrality of a chemical ingredient. Each node is colored according to community membership, which was determined using a modularity optimization method. The strength of the lines corresponds to the frequency of the combination into sampled formulae between two chemical ingredients. Vertex positions determined using spectral graph analytic methods according to the normalized Laplacian so that chemical ingredients that are strongly interconnected positioned nearer to each other. Boxes illustrate outstanding nodes and show dominant structural types of chemical ingredients characterizing communities. The numbers in the parentheses in the boxes indicate how many percentages of chemical ingredients are contained by representative herbs of specific communities. Representative herbs are top one or two Chinese medicines which contain more than 50% chemical ingredients in specific communities. Square brackets specify chemical ingredients at the distant positions by showing their chemical names, chemical structural types, and corresponding herbs.

