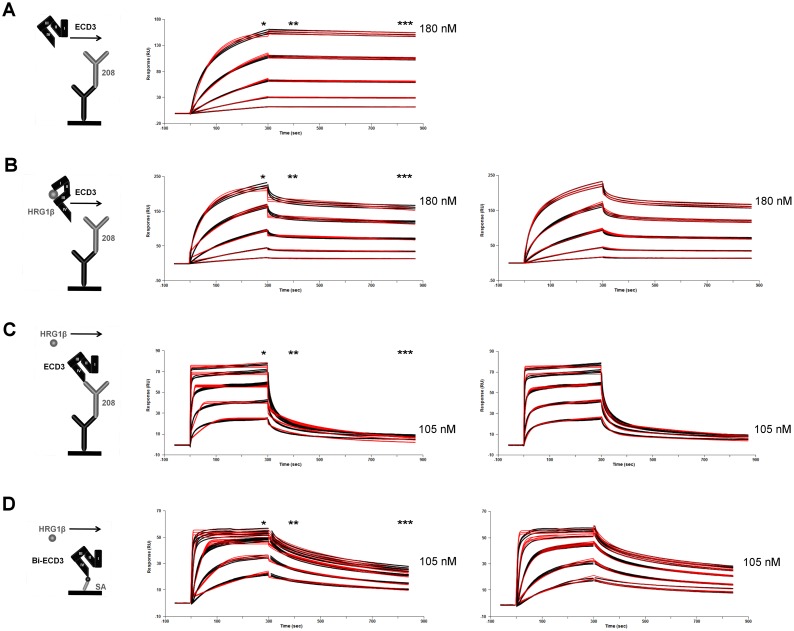
Figure 1. Deciphering the binding behavior of HRG1β to HER3, investigated by different SPR assay setups.
To determine the interaction of HRG1β with HER3 in presence and absence of anti-HER3 antibody mAb208, four different SPR assay setups were designed. The descriptive symbols illustrate the corresponding assay setups. Arrows indicate injection of analytes (left column). Measured biomolecular interactions were evaluated using a regular Langmuir model (middle column) and where applicable using a two-state reaction model (right column) by Biacore Evaluation Software 2.0. The curve fittings are highlighted in red. The curve corresponding to the highest concentration is indicated in each sensorgram. Report points were used to additionally characterize the shape of the sensorgrams. They are indicated by asterisk: BLearly (*) is the binding signal shortly before the end of the analyte injection. BLlate (**) is the binding signal 100 seconds after the end of the injection. SL (***) is the stability late signal at the end of the dissociation phase. Three replicates of each concentration are shown in black in each sensorgram (n = 3). The third highest concentration of each assay was injected twice (n = 6). (A—C) Murine antibody mAb208 was captured by immobilized rabbit anti-mouse antibody on CM5 sensor chip surface. (A) Injection of HER3 (ECD3). (B) Injection of pre-incubated HER3/HRG1β. (C) Injection of HRG1β. (D) Biotinylated HER3-Avi (bi-ECD3) was captured on a streptavidin-coated CAP sensor chip. Subsequently, HRG1β was injected.

