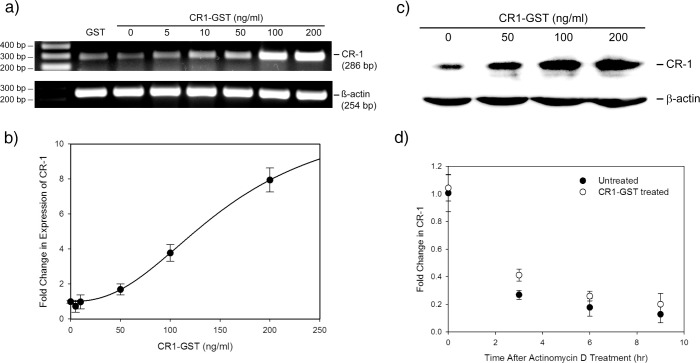
Fig 1. Treatment with recombinant CR-1 induces CR-1 expression.
U-87 MG cells were treated with different doses of CR1-GST or GST (200 ng/ml) for 24 hr. Expression of CR-1 was measured by (a) RT-PCR and (b) real-time PCR. Data of real-time PCR was fitted to Hill equation (fold change = 1+ 10.85 × dose2.37/(156.992.37+ dose2.37); R2 = 0.98). (c) Western blot to detect induction of CR-1 in U-87 MG cells treated with different doses of recombinant CR-1. (d) Fold change in CR-1transcript at different time points after treatment with actinomycin D in presence and absence of CR1-GST. No significant difference between treated and untreated cells (Rank Sum Test, p = 0.127). In (b) and (d) each data point represents average of four independent experiments.

