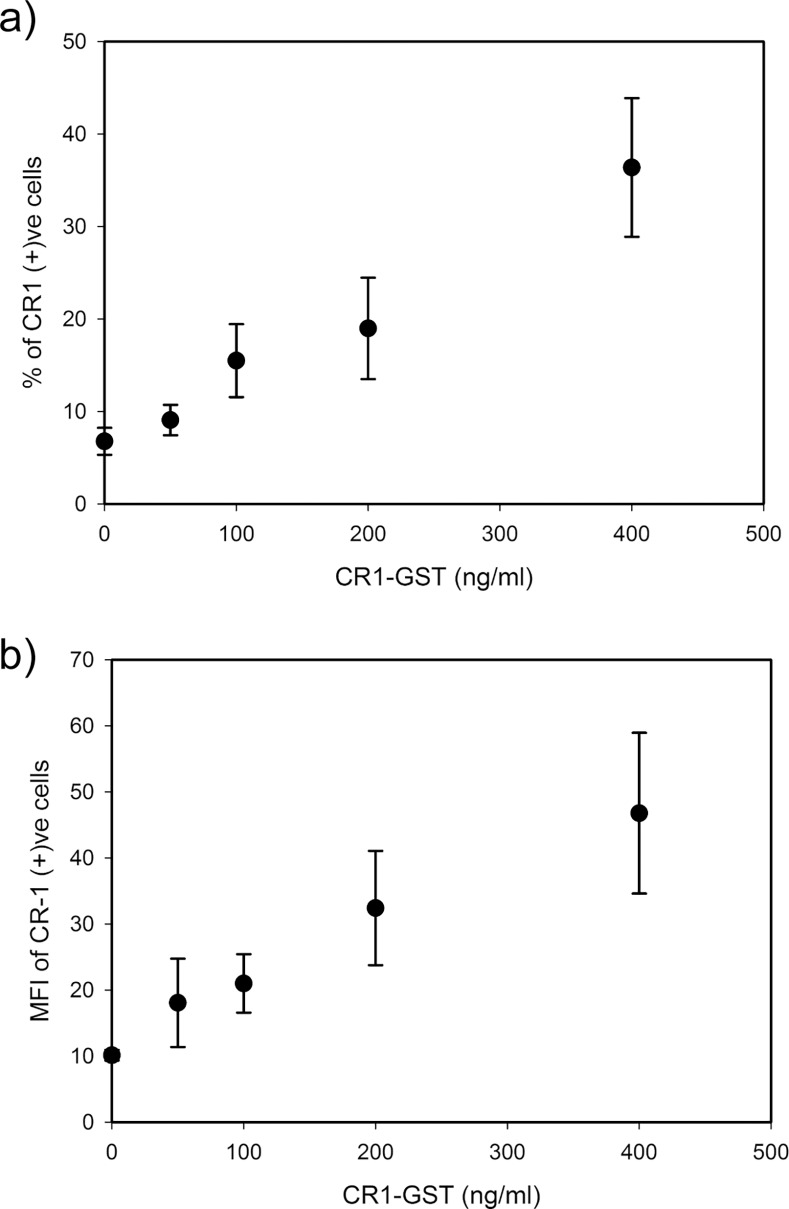
Fig 4. Dose dependent behavior of CR-1 positive subpopulation.
U-87 MG cells were treated with different doses of CR1-GST for 24 hr and expression of CR-1 was measured by flow cytometry. (a) Percentage of cells in CR-1 positive subpopulation and (b) level of CR-1 expression, measured in terms of MFI, in cells of CR-1 positive subpopulation. Each data point represents mean of three independent experiments.

