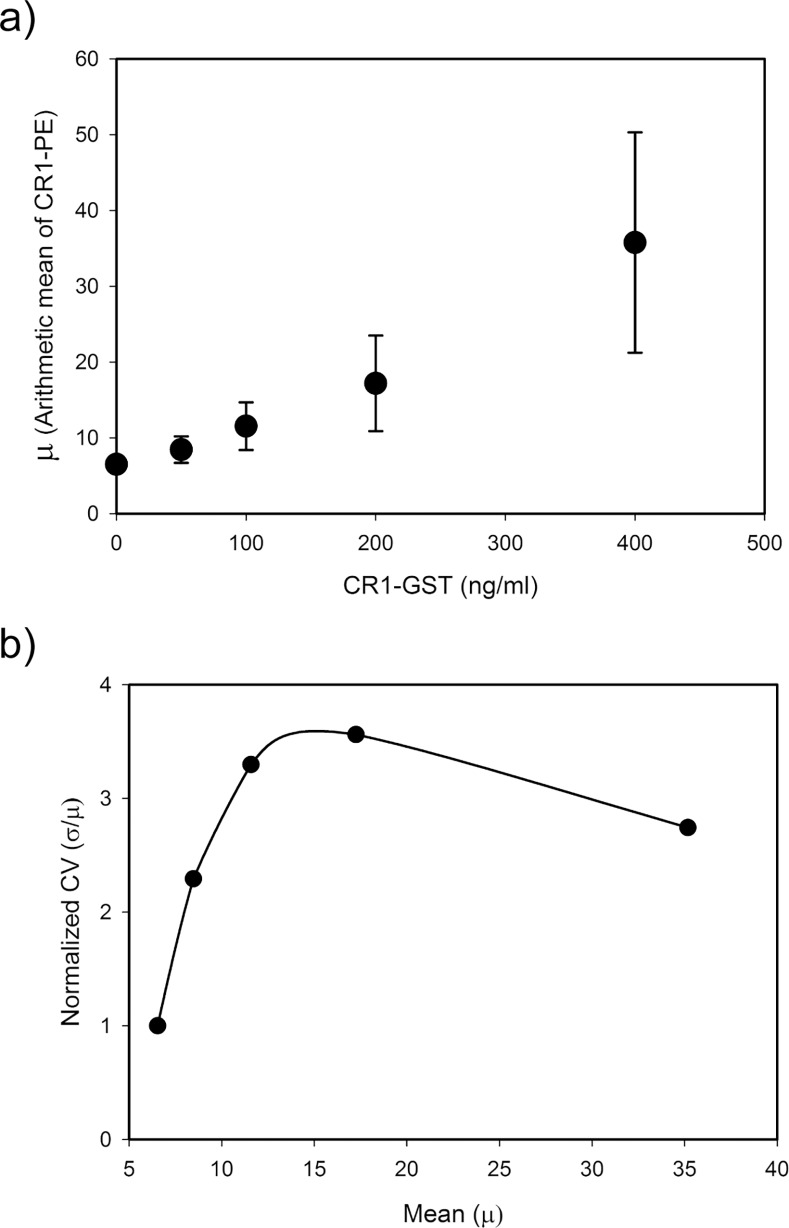
Fig 5. Noise in CR-1 induced expression of CR-1 in U-87 MG cells.
Expression of CR-1 was measured by flow cytometry. Panel (a) shows the change in mean of CR1-PE (FL2-H) reading for the whole population of cells with dose of recombinant CR-1. Panel (b) shows the relation between mean and noise in CR-1 expression. Noise is represented in terms of normalized CV. CV of CR1-PE (FL2-H) of each treated sample was normalized by dividing with that of untreated cells. Average results of three independent experiments are shown here.

