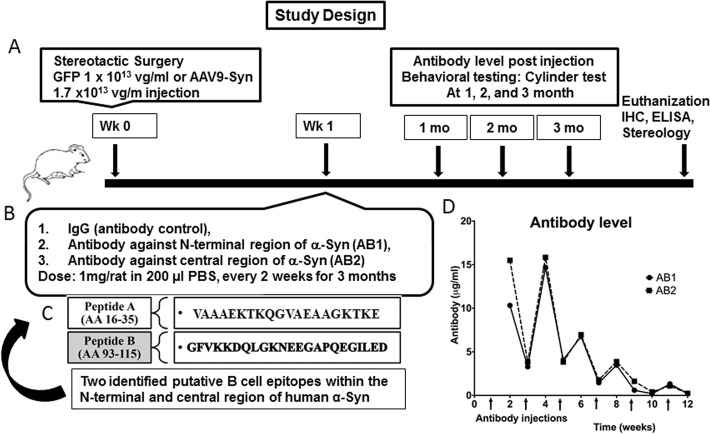
Fig 1. Study design to test the efficacy of anti- α-Syn antibody in rat AAV- α-Syn PD model.
A schematic diagram depicting (A) the details on AAV9 concentrations used and the time frame for AAV-9 injections and the behavioral testing, (B) the timing of the first antibody injections and initial dose, as indicated in the methods section the dose of the AB injected was reduced over time (C) the sequence of the antibodies and (D) level of serum antibodies taken 1 week after injections and just before subsequent injections. This demonstrates that antibody levels remained high for the first month and then clearance increased after 6 weeks. Times of injections are indicated by the arrows on the bottom of the graph.

